Add clip art to your file
Insert clip art
STEP 1:
Select Insert > Pictures > Online Pictures
(In Outlook, when you’re using the Reading pane, there isn’t an Insert menu. Click Pop Out 
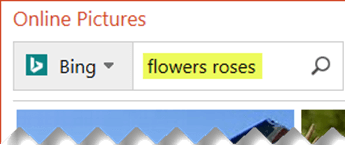
STEP 2:
Type a word or phrase to describe what you’re looking for, then press Enter.
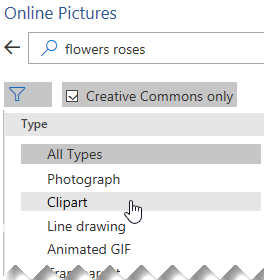
STEP 3:
Filter the results by Type for Clipart.
STEP 4:
Select a picture.

STEP 5:
Select Insert.
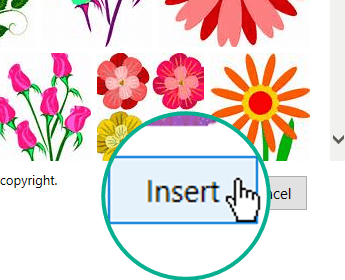
That’s it!
The image is inserted in your Office document.

Clip art and copyright
The licensing filter (Creative Commons only or All) can help you choose images that are appropriate for the use you have in mind. (Read about Creative Commons licenses here.)
When using pictures or clip art from Bing, you’re responsible for respecting copyright, and the license filter in Bing can help you choose which images to use.
New kinds of clip art for Microsoft 365
Microsoft 365 doesn’t have traditional clip art anymore, but as a subscriber you get several new kinds of high quality art in its place for free: high-resolution photographs, icons, cutout people, stickers, illustrations, and cartoon people. Select Insert > Pictures > Stock Images to see your options. For more details, see Insert images, icons, and more.


Draw a picture by combining and merging shapes
Applies To
Sometimes, the shape you want isn’t included in the built-in or default shapes. You can merge shapes to create the picture you want. You can also use Edit Points to modify a shape.
For other ideas, see Make your own custom shapes
Merge shapes
- Select the shapes you want to merge: press and hold the Ctrl key while you select each shape in turn.(If you don’t select any shapes, then the Merge Shapes button in step 2 will be grayed out.)
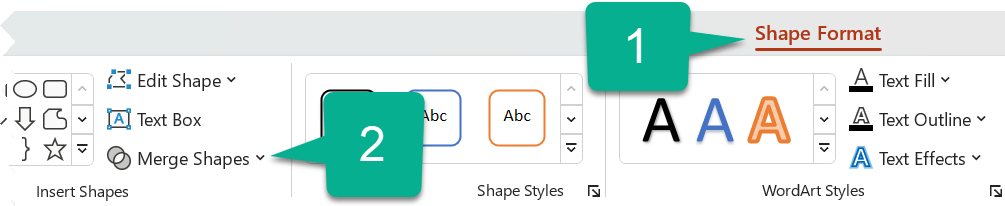
- On the Shape Format tab, in the Insert Shapes group, select Merge Shapes to see a menu of merge options.
- Select the Merge option you want. The following table illustrates the effect of each option on the sample of two circles that are slightly overlapping, like so:
OptionResultUnion
Intersect
Fragment
Subtract
Combine

Note that the order in which you select the shapes to merge may affect the options shown to you. If you’re unsatisfied with the choices you get, start over by unselecting the shapes, and then repeat this procedure, selecting a different shape first than you did in the previous attempt.
Use Edit Points to change a shape
- Select the shape you want to change.
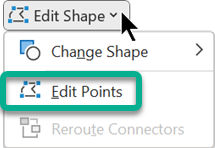
- On the toolbar, select the Shape Format tab, and in the Insert Shape group, select Edit Shape > Edit Points.
- Drag the black edit points to change the shape. Use the white square edit points to change the curvature of the line between two black edit points.
It’s easier to use edit points if the shape doesn’t have any fill or style. Add any color fill or effects after you have finished.
Here’s a detailed video showing the different ways to use edit points. It was created with an earlier version of PowerPoint, but the process is the same.
Reuse your custom shape in another Office program
If you want to use the shape later, right-click it, and select Save As Picture. Give the picture a name, and save it on your computer.
To insert the picture in a different Office program, open that program and select Insert > Pictures. Locate the picture on your computer, select it, and then select Insert.
Create an organization chart in Office by using SmartArt
Applies To
If you want to illustrate the reporting relationships in your company or organization, you can create a SmartArt graphic that uses an organization chart layout, such as Organization Chart.
Tip: An alternative way to draw an org chart is with Visio, the Microsoft diagramming app. If you have Visio, read about how to use it to make an org chart in Create an organization chart in Visio.
Overview of creating an organization chart
Use a SmartArt graphic to create an organization chart in Excel, Outlook, PowerPoint, or Word to show the reporting relationships in an organization, such as department managers and non-management employees.
If you’re unfamiliar with using SmartArt graphics, you might want to read the following articles before getting started on an organization chart:
Create an organization chart
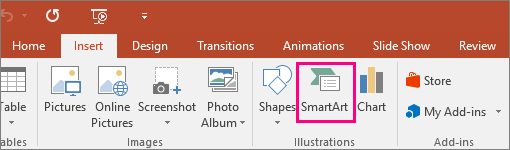
- On the Insert tab, in the Illustrations group, click SmartArt.
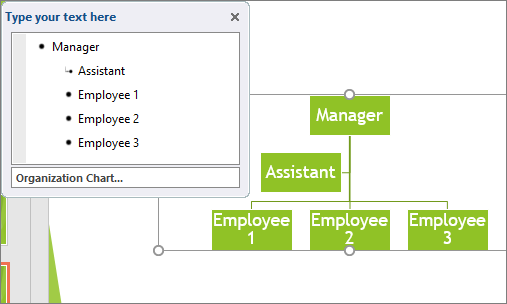
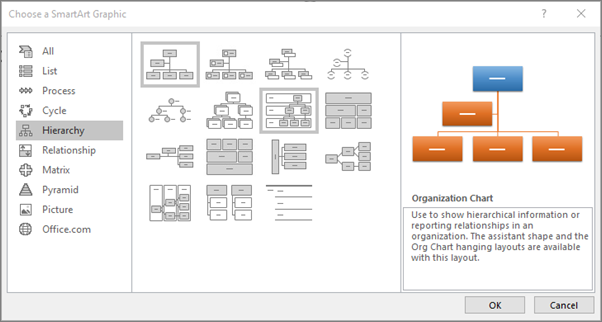
Example of the Illustrations group on the Insert tab in PowerPoint 2016 - In the Choose a SmartArt Graphic gallery, click Hierarchy, click an organization chart layout (such as Organization Chart), and then click OK.
- To enter your text, do one of the following:
- Click in a box in the SmartArt graphic, and then type your text.
Note: For best results, use this option after you add all of the boxes that you want.
- Click [Text] in the Text pane and then type your text.
Note: If the Text pane is not visible, click the control on the edge of the SmartArt graphic.
- Copy text from another location or program, click [Text] in the Text pane, and then paste your text.
- Click in a box in the SmartArt graphic, and then type your text.

What else would you like to do?
Create an organization chart with pictures
- In your document, presentation, or spreadsheet, on the Insert tab, in the Illustrations group, click SmartArt.
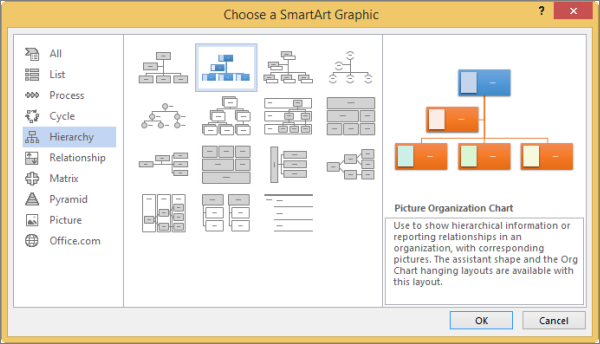
Example of the Illustrations group on the Insert tab in PowerPoint 2016 - In the Choose a SmartArt Graphic gallery, click Hierarchy, click Picture Organization Chart or Circle Picture Hierarchy, and then click OK.
- To add a picture, in the box where you want to add the picture, click the picture icon, locate the folder that contains the picture that you want to use, click the picture file, and then click Insert.
- To enter your text, follow the instructions in step 3 of Create an organization chart.
Add or delete boxes in your organization chart
Add a box
- Click the existing box that is located closest to where you want to add the new box.
- Under SmartArt Tools, on the Design tab (or SmartArt Design in newer versions), click the arrow next to Add Shape, and then do one of the following:
Note: If you do not see the SmartArt Tools or the Design or SmartArt Design tabs, make sure that you have selected the SmartArt graphic. You may have to double-click the SmartArt graphic to select it and open the Design tab.
- To insert a box at the same level as the selected box but following it, click Add Shape After.
- To insert a box at the same level as the selected box but before it, click Add Shape Before.
- To insert a box one level above the selected box, click Add Shape Above.The new box takes the position of the selected box, and the selected box and all the boxes directly below it are each demoted one level.
- To insert a box one level below the selected box, click Add Shape Below.
- To add an assistant box, click Add Assistant.The assistant box is added above the other boxes at the same level in the SmartArt graphic, but it is displayed in the Text pane after the other boxes at the same level.Add Assistant is available only for organization chart layouts. It is not available for hierarchy layouts, such as Hierarchy.
Delete a box
To delete a box, click the border of the box you want to delete, and then press the Delete key on your keyboard.
Notes:
- When you need to add a box to your relationship graphic, experiment with adding the shape before or after the selected shape to get the placement you want for the new shape.
- To add a shape from the Text pane:
- At the shape level, place your cursor at the end of the text where you want to add a new shape.
- Press Enter, and then type the text that you want in your new shape.
- To add an assistant box, press Enter while an assistant box is selected in the Text pane.
- Although you cannot automatically connect two top-level boxes with a line in the organization chart layouts, such as Organization Chart, you can imitate this look by adding a box to the top level to your SmartArt graphic and then drawing a line to connect the boxes. (On the Insert tab, in the Illustrations group, select Shape, select a line, and then draw a line between the two boxes.) Learn more about drawing lines by reading Draw or delete a line or connector.
- To move a box, click the box that you want to move and then drag the box to its new location. To move or “nudge” the box in very small increments, hold down Ctrl while you press the arrow keys on your keyboard.
Change a solid line to a dotted line
To show a dotted-line reporting relationship between two boxes, change the style of the line between the two boxes.
- Click the SmartArt graphic whose line you want to change.
- Right-click the line, and then click Format Shape on the shortcut menu.
- Click Line or Line Style, and then click the Dash type that you want.
Change the hanging layout of your organization chart
A hanging layout affects the layout of all boxes below the selected box. Although you can use other hierarchy layouts to create an organization chart, hanging layouts are available only with organization chart layouts.
- Click the box in the organization chart that you want to apply a hanging layout to.
- Under SmartArt Tools, on the Design tab (or SmartArt Design in newer versions), in the Create Graphic group, click Layout, and then do one of the following:
Note: If you do not see the SmartArt Tools or the Design or SmartArt Design tabs, make sure that you have selected a SmartArt graphic. You may have to double-click the SmartArt graphic to select it and open the Design tab.
- To center all of the boxes below the selected box, click Standard.
- To center the selected box above the boxes below it and arrange the boxes below it horizontally with two boxes in each row, click Both.
- To arrange the selected box to the right of the boxes below it and left-align the boxes below it vertically, click Left Hanging.
- To arrange the selected box to the left of the boxes below it and right-align the boxes below it vertically, click Right Hanging.
- To center all of the boxes below the selected box, click Standard.
Change the colors of your organization chart
You can apply color combinations that are derived from the theme colors to the boxes in your SmartArt graphic.
- Click the SmartArt graphic whose color you want to change.
- Under SmartArt Tools, on the Design tab (or SmartArt Design in newer versions), in the SmartArt Styles group, click Change Colors.
If you don’t see the SmartArt Tools or Design or SmartArt Design tabs, make sure that you’ve selected a SmartArt graphic.
- Click the color combination that you want.
Tip: When you place your pointer over a thumbnail, you can see how the colors affect your SmartArt graphic.
Change the color of a box in your organization chart
- Right-click the border of a box, and then click Format Shape on the shortcut menu.
- Under Fill, click Solid fill.
- Click Color, and then click the color that you want.
- To specify how much you can see through the background color, move the Transparency slider, or enter a number in the box next to the slider. You can vary the percentage of transparency from 0% (fully opaque, the default setting) to 100% (fully transparent).
Add SmartArt Style effects to your organization chart
A SmartArt Style is a combination of various effects, such as line style, bevel, or 3-D, that you can apply to the boxes in your SmartArt graphic to create a unique and professionally designed look.
- Click the SmartArt graphic whose SmartArt Style you want to change.
- Under SmartArt Tools, on the Design tab (or SmartArt Design in newer versions), in the SmartArt Styles group, click the SmartArt Style that you want.To see more SmartArt Styles, click the More button
.If you don’t see the SmartArt Tools or Design tabs, make sure that you’ve selected a SmartArt graphic.
Tip: In some older versions, for even more effect options, such as shadow, glow, and reflection, under SmartArt Tools, on the Format tab, in the Shape Styles group, click Shape Effects, and then choose the effect that you want.
Use charts and graphs in your presentation
Applies To
You can make a chart in PowerPoint or Excel. If you have lots of data to chart, create your chart in Excel, and then copy it into your presentation. This is also the best way if your data changes regularly and you want your chart to always reflect the latest numbers. In that case, when you copy and paste the chart, keep it linked to the original Excel file.
Try it!
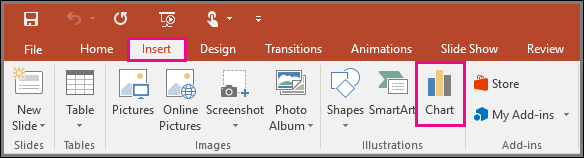
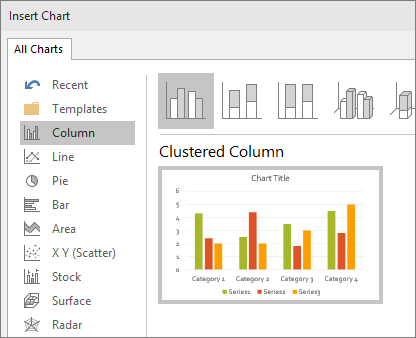
To create a simple chart from scratch in PowerPoint, click Insert > Chart and pick the chart you want.
- Click Insert > Chart.
- Click the chart type and then double-click the chart you want.
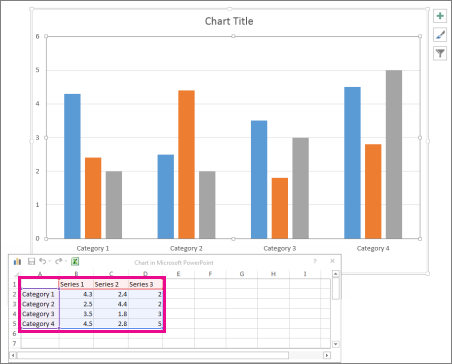
Tip: For help deciding which chart is best for your data, see Available chart types. - In the worksheet that appears, replace the placeholder data with your own information.
- When you insert a chart, small buttons appear next to its upper-right corner. Use the Chart Elements
button to show, hide, or format things like axis titles or data labels. Or use the Chart Styles
button to quickly change the color or style of the chart.Tip: The Chart Filters
button is a more advanced option that shows or hides data in your chart.
- When you’ve finished, close the worksheet.
Insert and update Excel data in PowerPoint
Applies To
If you are using a newer version of PowerPoint, you can link data from a saved Excel worksheet to your PowerPoint presentation. That way, if data in the worksheet changes, you can easily update it in your PowerPoint presentation.
Link a section of data in Excel to PowerPoint
In PowerPoint, you can embed tables and worksheets from Excel in your presentation slides.
- In Excel, click and drag to highlight the cells you want to copy.
- Right-click the copied cells and select Copy.
- In your PowerPoint presentation, right-click and select the Paste Options you want:
- Use Destination Styles – Choose to edit your copied cells like a PowerPoint table, but with PowerPoint’s color scheme and fonts.
- Keep Source Formatting – Choose to keep your table editable in PowerPoint while maintaining the same source formatting from Excel.
- Embed – Choose to keep a copy of your table in PowerPoint in case you want to edit the data, which will open in Excel.Note: If you’re working with a large Excel file, it’ll inflate your PowerPoint presentation to a big size. You may also unintentionally be giving more access to your Excel file than you intend to.
- Picture – Choose to paste your table as a picture to get the same benefits as embedding except you can format your cells like a picture and add effects to it. You won’t be able to edit data once it’s been pasted though.
- Keep Text Only – Choose to paste your table as straight text and to do all formatting in PowerPoint.
- If you pasted as a picture, on the Picture Tools Format tab, select the quick picture style you want to use. Adjust the table to your liking.
Update linked Excel data in PowerPoint
After you’ve used one of the methods described above to insert linked Excel data into a presentation, then refreshing the presentation to stay up to date with data changes is easy to do:
- In PowerPoint, right-click the data and select Update Link.
Link an entire Excel worksheet to PowerPoint
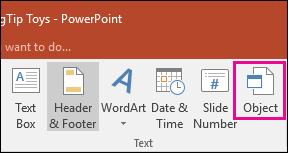
- In PowerPoint, on the Insert tab, click or tap Object.
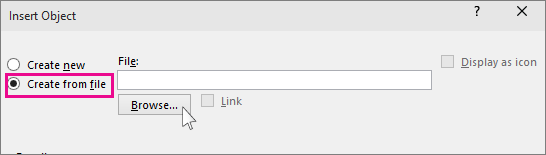
- In the Insert Object dialog box, select Create from file.
- Click or tap Browse, and in the Browse box, find the Excel workbook with the data you want to insert and link to.
- Before you close the Insert Object box, select Link, and click OK.
Important: The linked object in your presentation displays all the data from the active, top worksheet in the linked Excel workbook. When you save the Excel workbook, make sure the worksheet you want in your presentation is the one you see when you first open the workbook.
Copy and paste (unlinked) Excel data in PowerPoint
In this case, the Excel data will not be linked to your PowerPointpresentation. You copy the data from an Excel worksheet and paste it into your presentation. The worksheet does not send automatic updates to PowerPoint.
- In Excel, open the workbook with the data you want to copy.
- Drag over the area of data you want to copy, and on the Home tab, click or tap Copy.
- In PowerPoint, click the slide where you want to paste the copied worksheet data.
- On the Home tab, in the Clipboard group, click the arrow below Paste.
- Under Paste Options, pick one of the following. Move the mouse pointer over each Paste option to see a preview of what it would look like.
Use Destination Styles to copy the data as a PowerPoint table, using the format of the presentation
Keep Source Formatting to copy the Excel data as a PowerPoint table, using the format of the worksheet
Embed to copy the data as information that can be edited in Excel later
Picture to copy the data as a picture that can’t be edited in Excel
Keep Text Only to copy all the data as a single text box
Add a table to a slide
Applies ToWindowsmacOSWeb
You can add a table to a slide by creating it right in PowerPoint. You can also copy and paste a table from Word or Excel.
It’s not possible to convert existing slide text into a table. Insert an empty table, then add text to it.
Select a heading below to open it and see the detailed instructions.
Create and format a table in PowerPoint
- Select the slide that you want to add a table to.
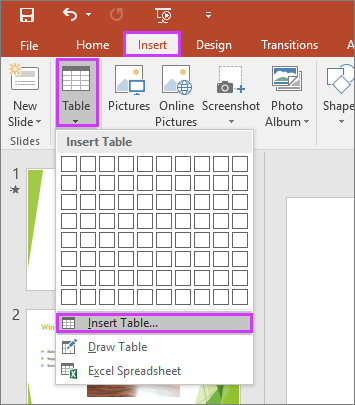
- On the Insert tab, select Table.
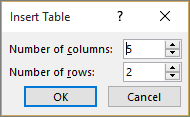
- In the Insert Table dialog box, do one of the following:
- Use the mouse to select the number of rows and columns that you want.
- Select Insert Table, and then enter a number in the Number of columns and Number of rows lists.
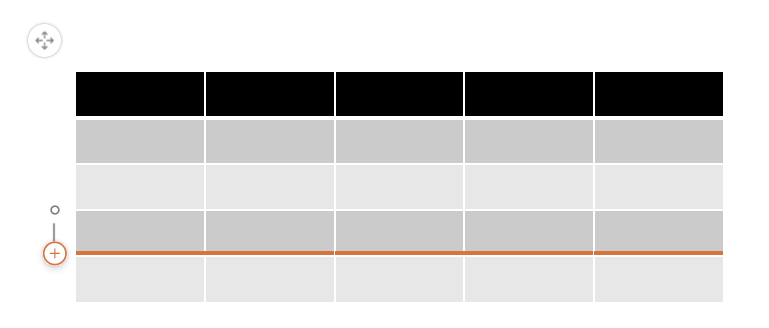
- To add text to the table cells, click a cell, and then enter your text. After you enter your text, click outside the table.Tips:
- To quickly insert a new row at the end of a table, click inside the last cell of the last row, and then press TAB.
- To add rows or columns, right-click a cell, click Insert on the mini toolbar, and choose where you’d like to insert the row or column.
- To delete rows or columns, right-click a cell, click Delete on the mini toolbar, and choose what you’d like to delete.
Copy and paste a table from Word
- In Word, click the table that you want to copy, and then go to Layout > Select > Select Table.
- On the Home tab, in the Clipboard group, select Copy.
- In your PowerPoint presentation, select the slide that you want to copy the table to, and then on the Home tab, in the Clipboard group, click Paste.
Tip: You can also copy and paste a table from your PowerPoint presentation onto an Excel worksheet or into a Word document.
Copy and paste a group of cells from Excel
- To copy a group of cells from an Excel worksheet, click the upper-left cell of the grouping that you want to copy, and then drag to select the rows and columns that you want.
- On the Home tab, in the Clipboard group, select Copy.
- In your PowerPoint presentation, select the slide that you want to copy the group of cells to, and then on the Home tab, in the Clipboard group, click Paste.
Tip: You can also copy and paste a table from your PowerPoint presentation onto an Excel worksheet or into a Word document.
Insert an Excel spreadsheet within PowerPoint
When you insert an Excel spreadsheet into your presentation, it becomes an OLE embedded object. If you change the theme (colors, fonts, and effects) of your presentation, the theme does not update the spreadsheet you inserted from Excel. You also won’t be able to edit the table by using options in PowerPoint.
- Select the slide that you want to insert an Excel spreadsheet into.
- Go to Insert >Table, and then choose Excel Spreadsheet.
- To add text to a table cell, click the cell, and then enter your text.After you enter your text, click outside the table.Tip: To edit the Excel spreadsheet after you have deselected it, double-click the table.
After you add a table to your presentation, you can use the table tools in PowerPoint to make formatting, style, or other types of changes to the table. To learn how to edit what you added to your PowerPoint presentation, see Change the look of a table.
I want to animate individual cells, rows, or columns in my table
Applies To
Follow these steps to mimic the effect of animating parts of a table. The process involves changing the table to a set of drawing objects that you can then ungroup and animate separately.
Important: This procedure converts tables to drawing objects and removes any effects, such as reflection, cell bevel, shadow, or fills (gradient, picture, and texture) that you applied to the table.
- Duplicate the slide that has the table you want to animate. For now it’s your backup, in case you have difficulty with this process, or want to reuse the table later.
- Select the thumbnail of the slide in the left margin in Normal view. On the Home tab of the ribbon, select the arrow next to the
Copy button and choose Duplicate.
- Select the thumbnail of the slide in the left margin in Normal view. On the Home tab of the ribbon, select the arrow next to the
- On the duplicate slide you’ve created, point to a border of the table, and select the entire table.
- On the Home tab of the ribbon, select
- In the Clipboard group, select the arrow under Paste, and then choose Paste Special.
- Choose Picture (Enhanced Metafile), and select OK. (Enhanced metafile format helps to prevent the pasted table image table from degrading.)
- On the Picture Format tab select
Group in the Arrange group, and choose
Ungroup.When prompted to convert the picture to a Microsoft Office drawing object, select Yes. For more information about the conversion process, select Show Help.
- Repeat the Ungroup command a second time. Selection handles will appear on all the individual cells in the table. Select outside the table to clear these selections.
- Press and hold the Ctrl key while you select the parts of the table to animate.
- On the Animations tab, select Add Animation in the Advanced Animations group to open the menu of animation options:
- To make the shapes enter with an effect, point to Entrance and select an effect.
- To add an effect (such as a spin effect) to the shapes, point to Emphasis and select an effect.
- To add an effect that makes the shapes leave the slide at some point, point to Exit and select an effect.
- To add an effect that makes a shape move in a specified pattern, point to Motion Paths and select a path.
- On the Timing tab, click any additional options that you want to use, such as Duration or Delay.
- Repeat steps 8 through 10 for any other elements of the table that you want to animate separately.Remove the original table from the duplicate slide, so only the new enhanced metafile version of the table remains on the slide.
Tip: If you don’t want to convert the table to a picture to animate it, you can create separate tables for each part that you want to animate. For example, if you want the data in a table to fly in separately from the header row of the table, then the first table should contain the header row information and the second table should contain the data. Align the left sides of the two tables and the bottom of the first table (header row) with the top of the second table (data) to make them appear as a single table. Then apply animations separately to the two tables to achieve your desired effect.
1: Two separate tables not aligned
2: Two tables aligned to appear as one
Add or delete table rows and columns
Applies To
You can use the table tools to easily add and delete table rows and columns in PowerPoint.WindowsmacOSWeb
Add a row
Option 1: Use Hover & Click
Option 2: Use Ribbon
- Click a table cell in the row above or below where you want the new row to appear.
- On the Table Layout tab, in the Rows & Columns group, do one of the following:
- To add a row above the selected cell, click Insert Above (or Insert Row Above).
- To add a row below the selected cell, click Insert Below (or Insert Row Below).
- Notes:
- To add multiple rows at once, using your mouse, drag to select an equal number of rows to the amount that you want to add, and then click Insert Above or Insert Below. For example, select three existing rows, click Insert Above or Insert Below, and three more rows will be added.
- To add a row at the end of a table, click the rightmost cell of the last row, and then press Tab.
Add a column
- Click a table cell to the right or the left of the column where you want the new column to appear.
- On the Table Layout tab, in the Rows & Columns group, do one of the following:
- To add a column to the left of the selected cell, click Insert Left (or Insert Column Left).
- To add a column to the right of the selected cell, click Insert Right (or Insert Column Right).
Add a header row
- Select any cell within the table.
- On the Table Design tab, in the Table Style Options group, select Header Row.
- Enter the column headings in the first row of the table.
Delete a row or column
- Click a table cell in the column or row that you want to delete.
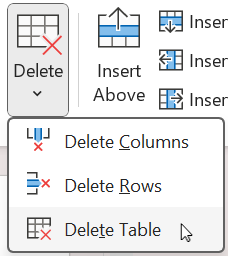
- On the Table Layout tab, in the Rows & Columns group, click Delete, and then click Delete Columns or Delete Rows.
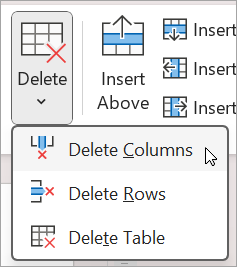
Delete a table
- Click the table to select it.
- On the Table Layout tab, in the Rows & Columns group, click Delete, and then click Delete Table or press Delete on your keyboard.